Reports overview
Process reports help you track and analyze how your process is functioning.
Access your reports by clicking the Reports button in the upper-right corner of the process page. Reports are available by default to all Process Admins. You can also share individual reports with other members of the process.
Viewing reports
Use Search to find any report by name quickly. You can use the Sort button to rearrange your reports based on their created date, last modified time, and alphabetical order.

Creating a new report
To create a new report, click + Create report. Choose the type of report, provide a name for the report, and click Create.
Types of reports
- Tabular: Displays information in columns and rows.
- Charts: Displays data graphically in one of ten chart types, including area, bar, doughnut, line, pie, and bubble chart.
- Pivot tables: Quickly summarize large quantities of data. You can convert columns into rows and rows into columns.
All Items report
The first time you open the Reports page, you’ll see an auto-generated report called <Process_name> All Items. This tabular report shows every item in your process. It cannot be deleted or renamed, but you can configure it.

Metrics report
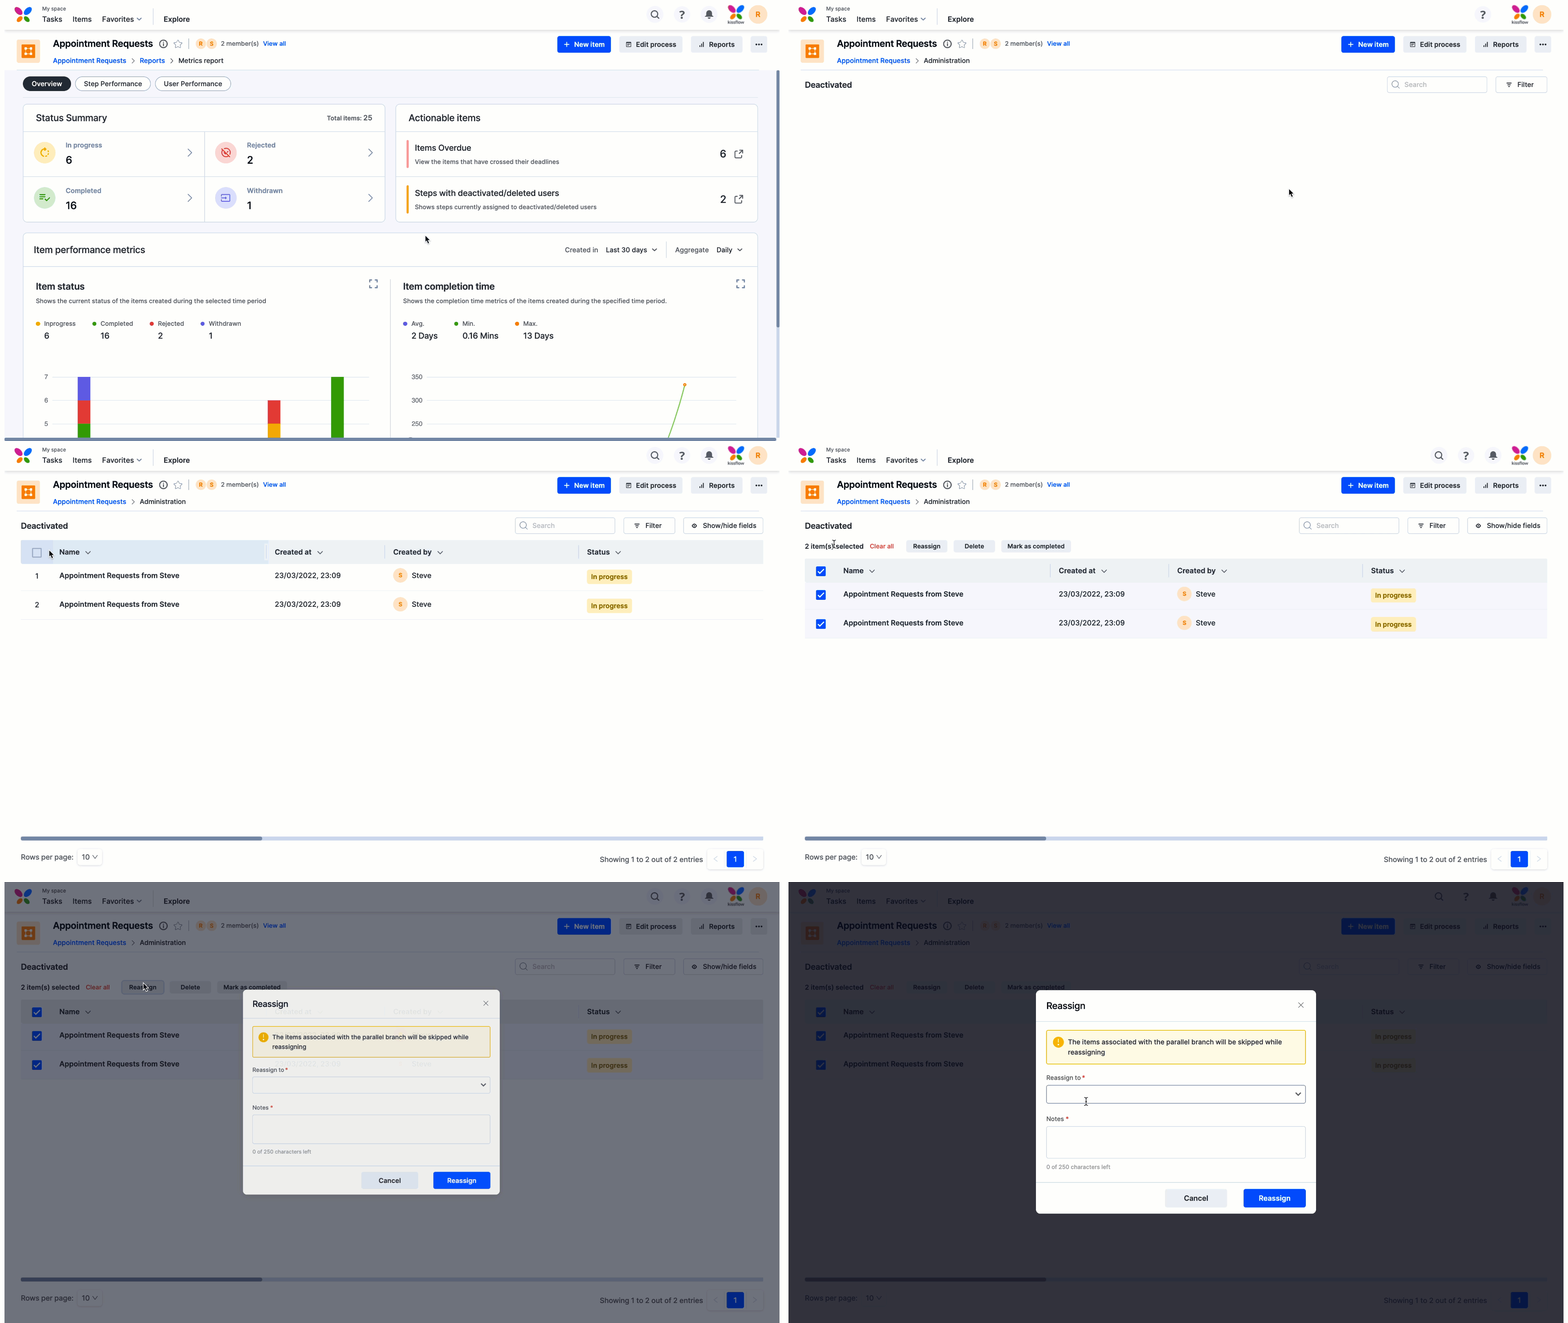
View the status summary, aging, step performance, and item performance metrics of the process with the help of our metrics report.
To access your process metrics,
- Navigate to the process page for which you would like to access its metrics.
- Click
Reports.
- Click the Metrics report to access the metrics of the process you are currently in.

The process metrics report gives you an overview of how your process is performing.
Overview
The Overview tab provides the following details:
- The status of all the items in your process.
- The number of items that require your attention.
- The overall item performance metrics, which include all the items' status and their completion times.

Status summary
The Status summary section shows the number of items in different statuses.
- In progress displays the number of items in progress in the workflow.
- Completed displays the number of items that traveled the workflow from start to finish.
- Rejected displays the number of items rejected before completing the workflow.
- Withdrawn displays the number of items the initiator withdraws before completing the workflow.

Actionable items
The Actionable items section shows two cards with the following metrics:
- The number of items that have crossed their deadline.
- The number of items currently assigned to deactivated/deleted users.
If you click the item, you can reassign the tasks, view the form data, and review the workflow progress. You can use the Search and Filter tools to find items quickly. You also have the option to delete items in bulk.

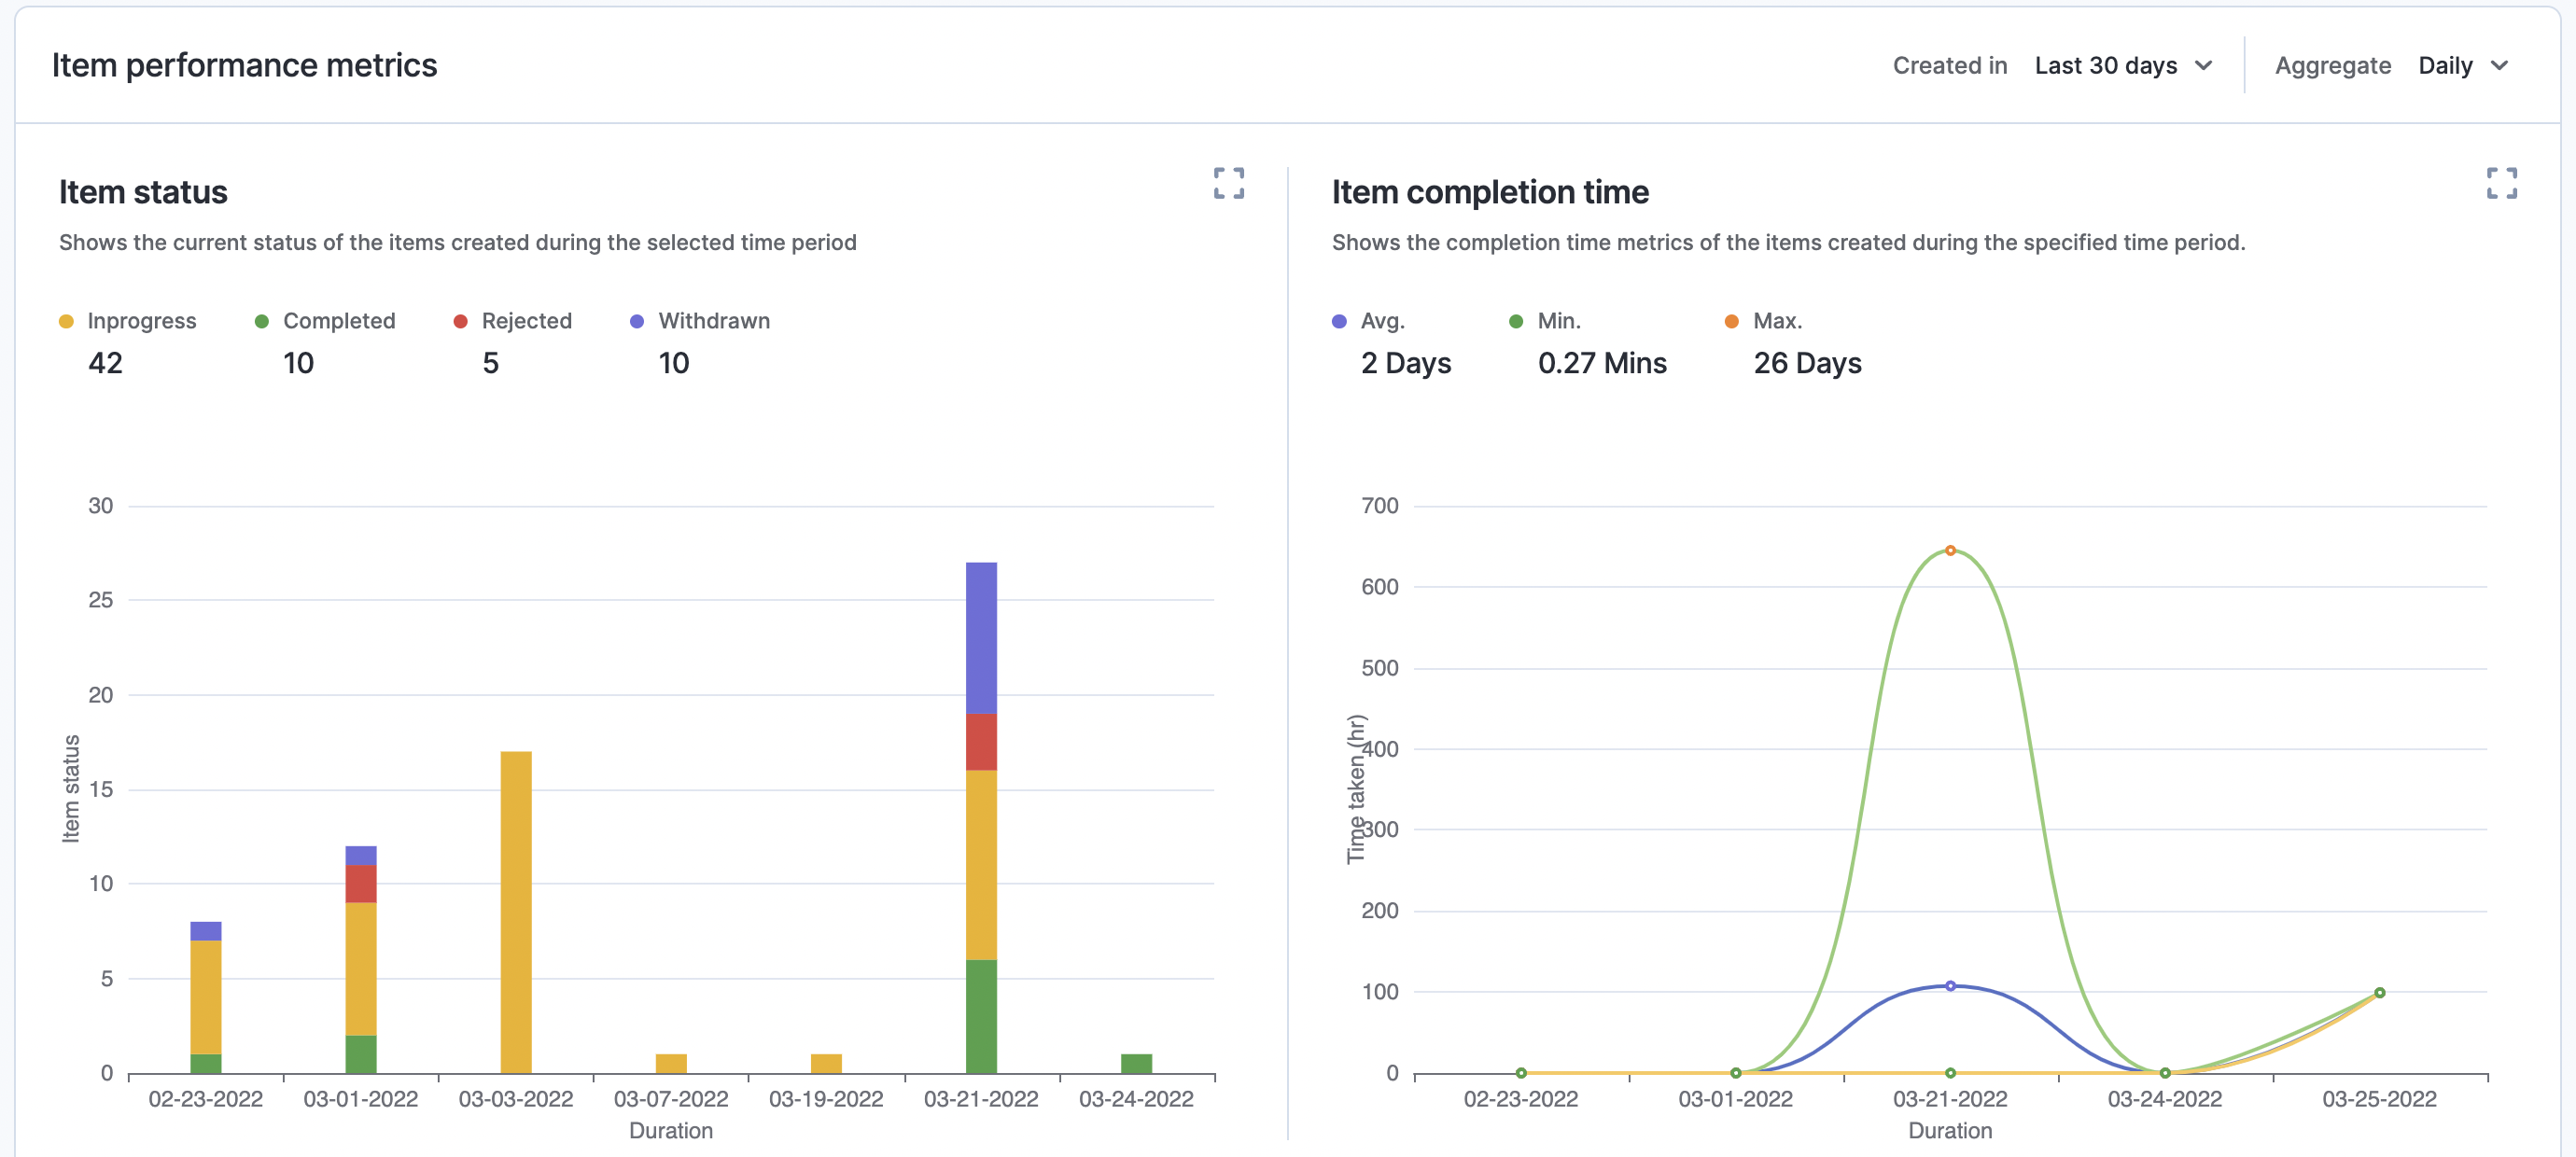
Item performance metrics
Find graphical interpretation of your process items in the following sections.
- Item status - A stacked bar graph represents the current status of items created during a selected time.
- Item completion time - A line graph represents the completion time of items by plotting the minimum, maximum, and average time taken to complete individual items.

Step performance
The Step performance tab contains the Step metrics section and the Aging metrics section.
The Step metrics shows vital metrics for each step, including:
- The minimum time taken to complete a task (Holidays excluded).
- The maximum time taken to complete a task (Holidays excluded).
- The average time taken to complete a task (Holidays excluded).
- The number of times an item was sent back at this step.
- The number of times an item was rejected at this step.
- The number of times an item completed this step.
- The number of times an item was withdrawn at this step.
Click the Expand button (
Click the colored numbers to get a drill-down report and perform admin actions.
Aging metrics show the number of items currently in each step and how long they have been there. Click the colored numbers to view the items and perform admin actions.

User performance
This tab shows user assignment and performance based on item status metrics for the selected duration. You can see the number of items assigned to a user across different statuses. You can also click the numbers to get the details of the items assigned to the user in that particular status. You can use the Search and Sort options to find and sort the data by fields or alphabetically.
You can set a custom time range of up to one year. For example, you can choose any range between April 02, 2024, and April 01, 2025.

Use the User Performance section in the Process Metrics report to view requests assigned to users within a specific process. To get a broader view across multiple processes, use the User workload report in Analytics for a consolidated look at user assignments.
Administering a report
After you have created a report, you have several ways to administer it. Most of these options are available by clicking the More options button (![]() ) on the report.
) on the report.

- Share - Click the Add button (
 ) to share the report with others. By default, they'll be given privileges to only view the report. On top of that, you can click the More options button (
  ) beside a user's name and share and edit the report, and view the form too.

- Removing a user - Click the Add button (
 ) > More options button (
  ) beside a user's name > Remove member
 - Export - Export all the data in the report as a CSV or JSON file. Exporting is only available for tabular reports and the All Items report. After exporting, you will receive an email with a link to download the report.
Here are a couple of tips while exporting reports:Note:
You can export your report to a CSV, or JSON file for your process forms with a maximum of one table in their form data.
If you haven’t received the exported report, please check your Spam, Promotions, Junk, or other folders in your mailbox. If you still can’t find it, feel free to contact Kissflow Support for assistance.
- If the CSV option is disabled, your report has more than one table in the process form, or you've selected a workflow step in the report. In this case, you can export the report as a CSV (Multiple files) or JSON.
- Edit - Change the data, arrangement, and filters applied to your report.
- Rename - Change the name of the report.
- Duplicate - Create a new report with the same structure. You can rename the new report or keep the default name Copy of <report name>.
- Delete - Delete the report entirely.
