
Audit log
Overview
The audit log is a centralized record of all activities that take place in your Kissflow account. It helps administrators track who did what, when, and from where by capturing events across your account, such as, user activity, security-related events or changes made to account settings and flows.
Audit logs preserve the record of actions taken in your account, giving admins clarity, traceability, and oversight. You can also filter for specific events and export logs for compliance or analysis purposes.
The account-level audit log is available to the Super Admins, IAM Admins (account management logs) and User Admins (user and group management logs). To view audit log, go to Profile > Account administration > Audit log.
Similarly, audit logs for flows is available to flow admins across process, boards, datasets, integrations, apps and portals. They can be accessed by clicking the More options button (  ) > Audit log.
You can get the following details from the Audit log section of your account:
- Timestamp: The exact time when a specific action happened or was performed.
- Acted by: The account user who acted.
- Event: The kind of activity or action that had taken place. Examples include Dataset permission change, Account ownership transferred, User activated, Account security updated, Field modified, IP address, etc.
- Event category: Common name for an event that you can use to filter down to similar events. Examples: Process Administration, Case Administration, etc.,
- Object: The resource that is updated.
- Audit ID: This unique ID is generated automatically by the system for every event recorded as part of the history.
- Platform: The device or Operating System (OS) used to record the event.
- IP: The network IP address of the recording device.
- Batch ID: This unique ID is generated automatically by the system for a group of related events. Unlike Audit ID, the Batch ID of these events will be the same for reference purposes.
Activities across the account appear in the audit log with a delay, typically from a few minutes to a few hours in some cases.
Interpreting the audit log
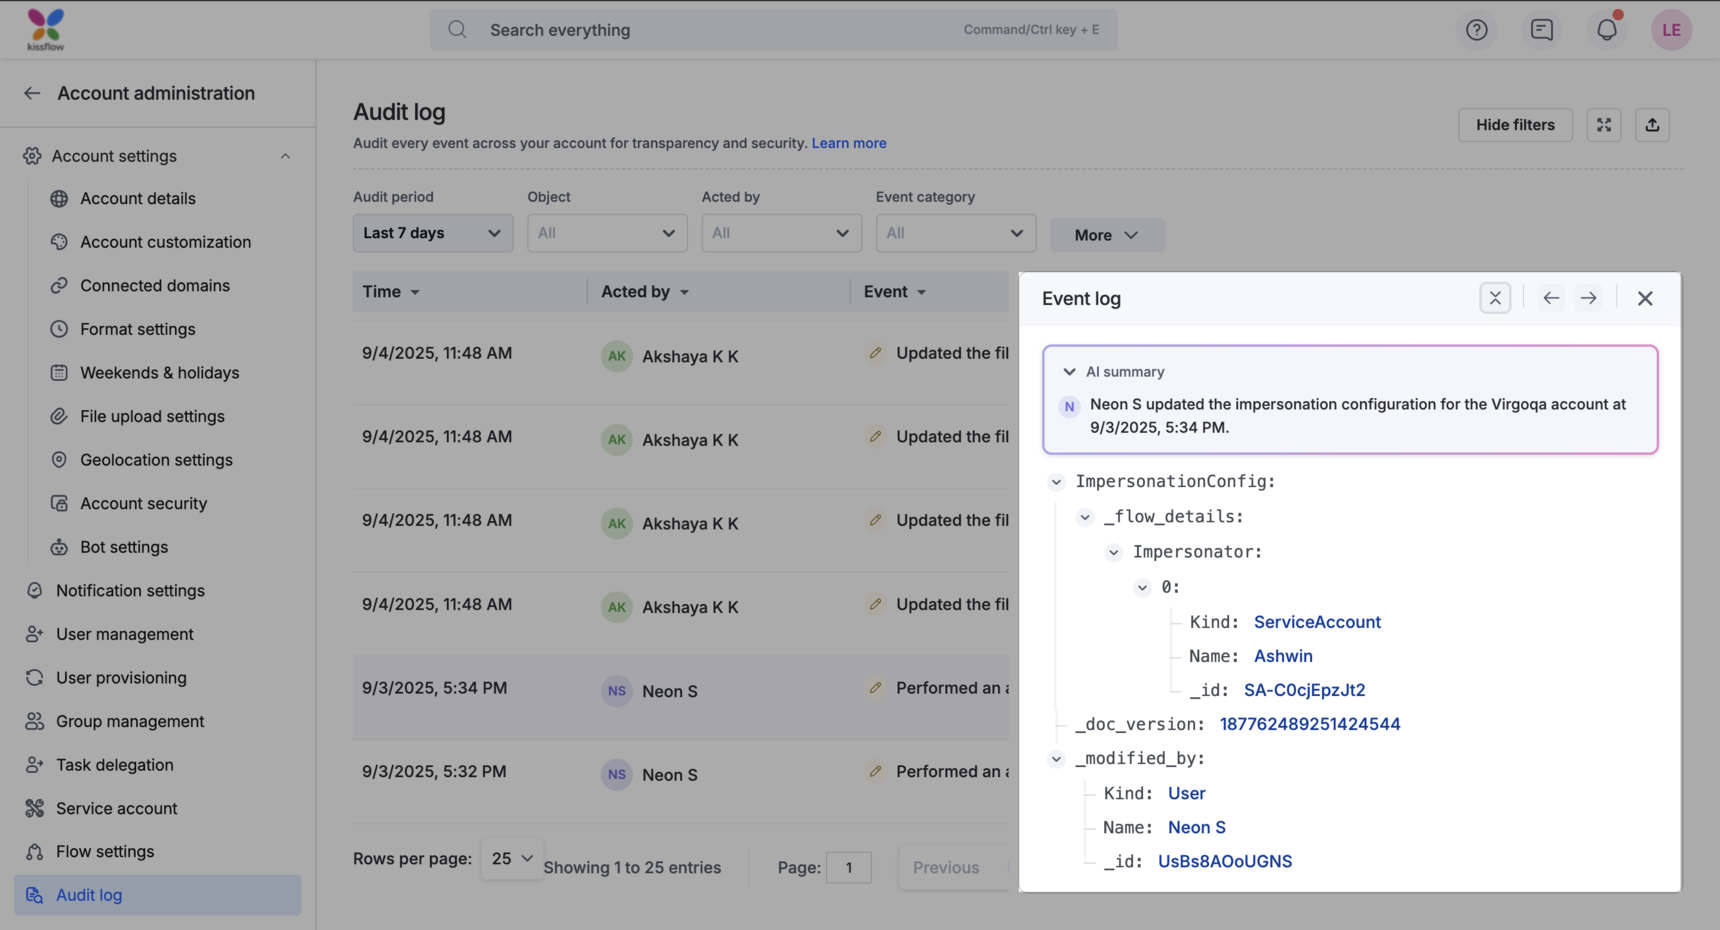
When you click on an entry in the audit log, the Event log panel opens on the right as shown in the gif below. You will see an AI-generated summary followed by the complete metadata and you can use the navigation arrows to move to the previous or next record without closing the panel. More about each section here:
AI summary: This is a short AI-generated summary at the top of the panel providing a quick overview of the event before going through the raw details.
Complete metadata view: Below the AI summary, the event metadata is displayed in a structured format. The keys and values are displayed in JSON format, and you can expand or collapse nested objects to drill down into deeper details.
Navigation controls: You can move between events directly from this panel using the arrow controls at the top as shown in the gif below.
Using filters
When you click Show filters, additional filtering options appear, letting you narrow down the audit log results. You can hide the filter panel anytime by selecting Hide filters, to keep the focus back on the log entries.
You will be able to filter the Audit log events based on the following fields/criteria:
- Audit period
- Fixed date range: Get event logs for the Last 7 days, Last 30 days or Last 90 days.
- Custom date range: Select a customized date range (within the last 30 days) to filter events.
- Object: Select one or more objects from the suggestions or enter the exact object name you would like to derive the log details for.
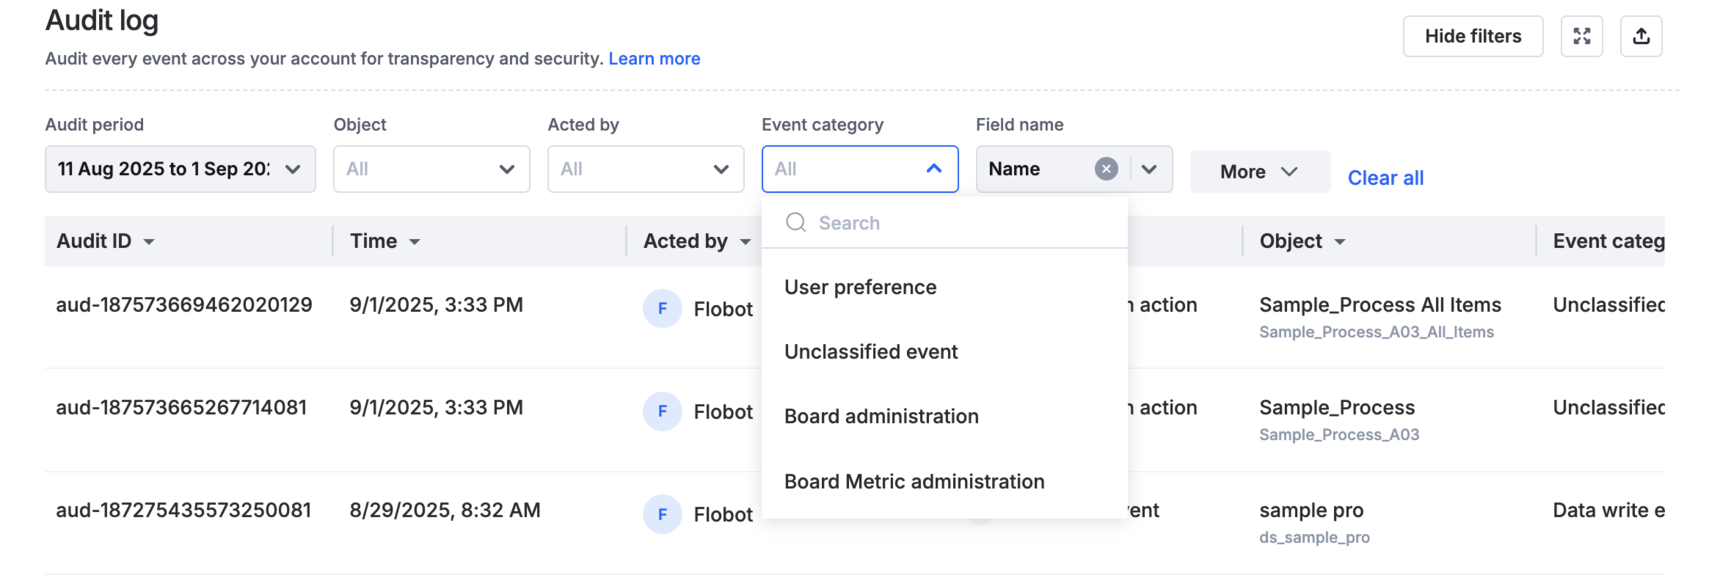
- Event category: Filtering events based on Event category is a recommended way to get specific events from the Audit log. If you are unsure how to go with the event category, enter a flow name like process or board in its search bar, and it will list all the categories relevant to the entry.
- Acted by: You can filter events based on users.
- Event: Select one from the suggested list of actions as necessary. You can filter events based on one action at a time.
Field name: This filter lets you drill deeper into specific attributes of an event. You can combine it with other filters for more precise results.
For example, in the gif below, the Acted by filter is set to Neon S, and the Field name filter is set to LastLoggedIn. This helps you audit all records related to Neon’s login activity. You can move through the entries using the previous/next arrows in the event panel. You can investigate each login and logout event in detail for Neon S and get a clear picture of his access timeline.
- Audit ID, Batch ID, and IP: Filters are applied on these fields mostly to backtrace an event's history. Enter the exact Audit ID, Batch ID, or IP address to filter events as necessary.
- Platform : Narrow down audit log results based on the operating system of the device from which the action was performed.
- To clear a specific filter condition, click the Remove button (
 ).
).
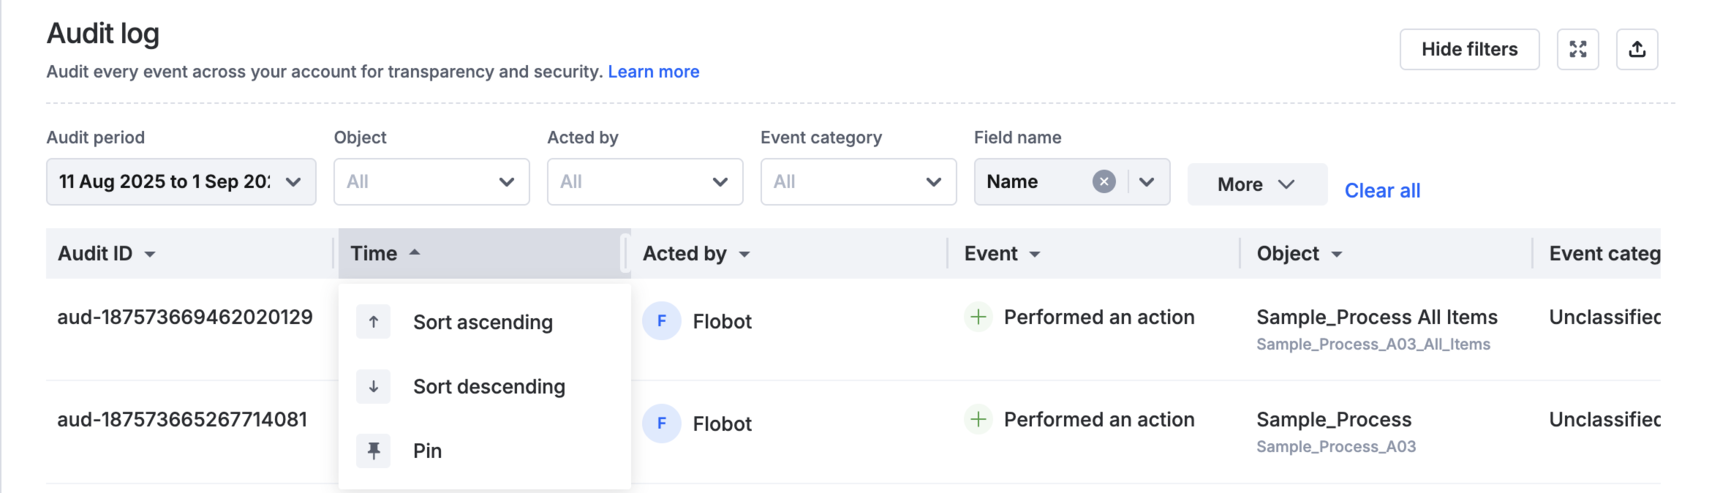
Sorting and pinning columns
Alternatively you could sort records in ascending or descending order to get faster to the desired event log. You can also pin a column, keeping it fixed while scrolling horizontally, so important details stay visible at all times.
Exporting an audit log
Click Export (  ) to download your audit logs. In the export dialog, you can choose how you want the data delivered:
- Filtered data – Export only the results currently shown after applying filters.
- All data from the last 90 days – Export the complete activity log for the past 90 days.
Optionally, convert all date and time fields in the log to match the time zone set in your My settings. Once you confirm, a link to the CSV file (packaged in a ZIP format) will be sent to your registered email address.
Note:
For export needs beyond a 90-day period, please reach out to customer support.