
Analytics in apps

Analytics lets App developers extract valuable insights from various forms in the app. Each form’s data is represented in Analytics through tables, allowing the creation of tabular, chart, pivot reports by combining different forms. The data within analytics is updated within an hour.
To access analytics in apps:
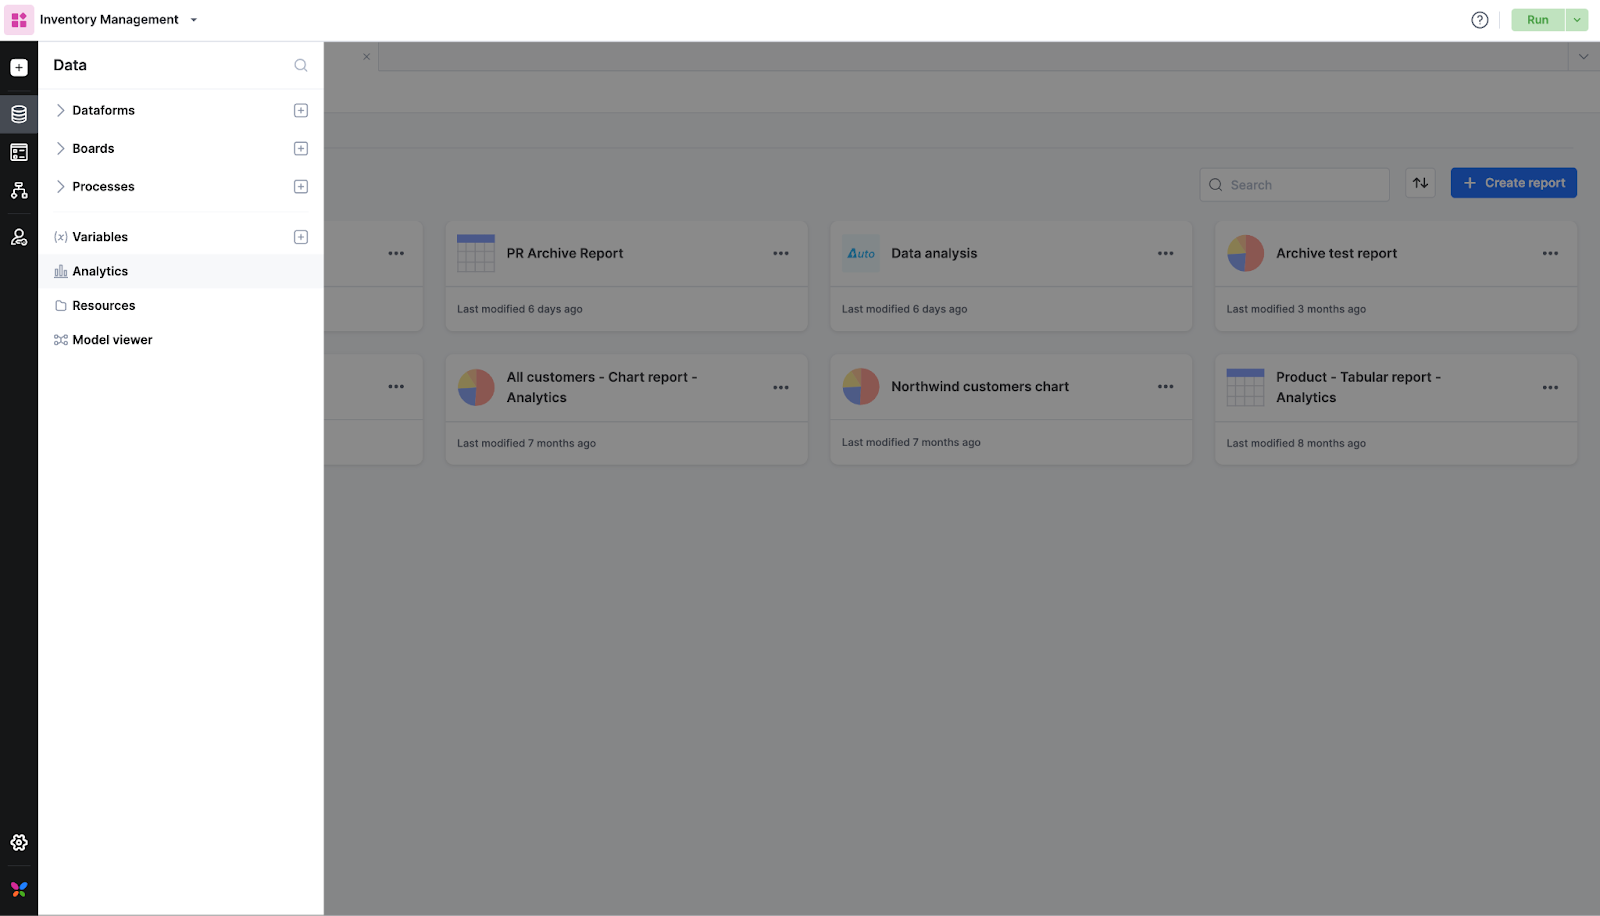
Inside the app builder, navigate to the left panel > click Data.
Select Analytics to view reports and dataviews you have created or have access to.
What can you do with Analytics in Apps?
Create dataviews from one or more tables or other dataviews.
Create reports based on dataviews or tables.
Configure drilldown in reports.
Creating dataviews in apps
A dataview involves combining attributes from one or more forms such as process, board, and dataforms, in your app, and the resulting data will be in a tabular format. To create a dataview in apps, follow these steps:
Sign into Kissflow.
Create an app or open an existing app.
Inside the app builder, on the left navigation panel, under Data > click Analytics > Dataviews > Create dataview.
Add an SQL query in the query editor and run it.
Click Save to publish a dataview.
Once created, you can use the dataview to generate reports inside Apps.

Note: The Analytics module present in an app caters only to the reports created within the specific app. Similarly, all data sources created within an app are exclusive and cannot be accessed by another app within the same Kissflow account.
Creating analytics reports
You can generate reports for processes, boards, dataforms, and dataviews to make it easy to understand trends, patterns, and outliers in your app. You can also combine different forms using dataviews and generate reports.
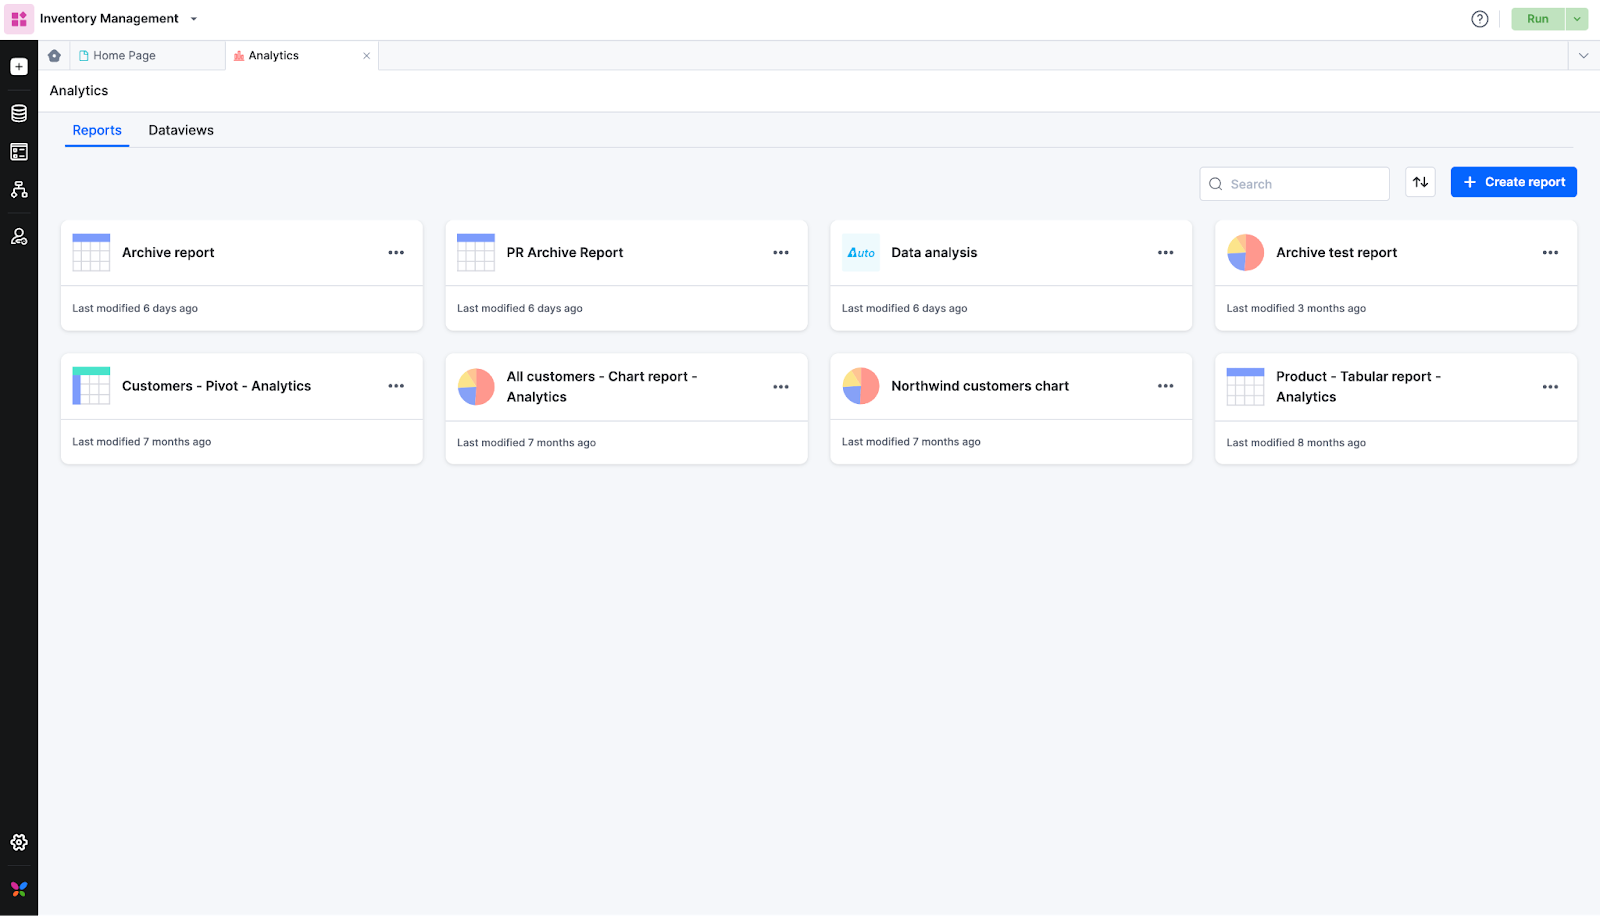
Every report is displayed in a card view. You can find out the following details from these cards:
- Name
- Report type
- Share status of the report
You can search for any reports you created inside Analytics. You can also sort the reports according to Created at, Last modified, or Alphabetical order.
To create a report, follow these steps:
Under the Analytics tab > Reports > Create report.
Select the required data source, report name, and description.
Choose the type of report: Table, Chart, Pivot.
Click Create.
Enabling drilldown in chart and pivot reports
The drilldown feature allows you to delve deeper into your report data by displaying a tabular view of the underlying rows associated with specific data points in chart and pivot reports.
To enable drilldown in reports,
- Navigate to the Settings tab in report configuration page.
- Under Drilldown, select the fields.
- Click Apply.
Hover over your chart or pivot report and click to drill down into the data. A tabular view will appear, showing the underlying rows related to the clicked data point. You can search fields, show/hide columns, and sort data by clicking the dropdown on each column header. Additionally, you can export data at runtime.

Sharing and exporting a report
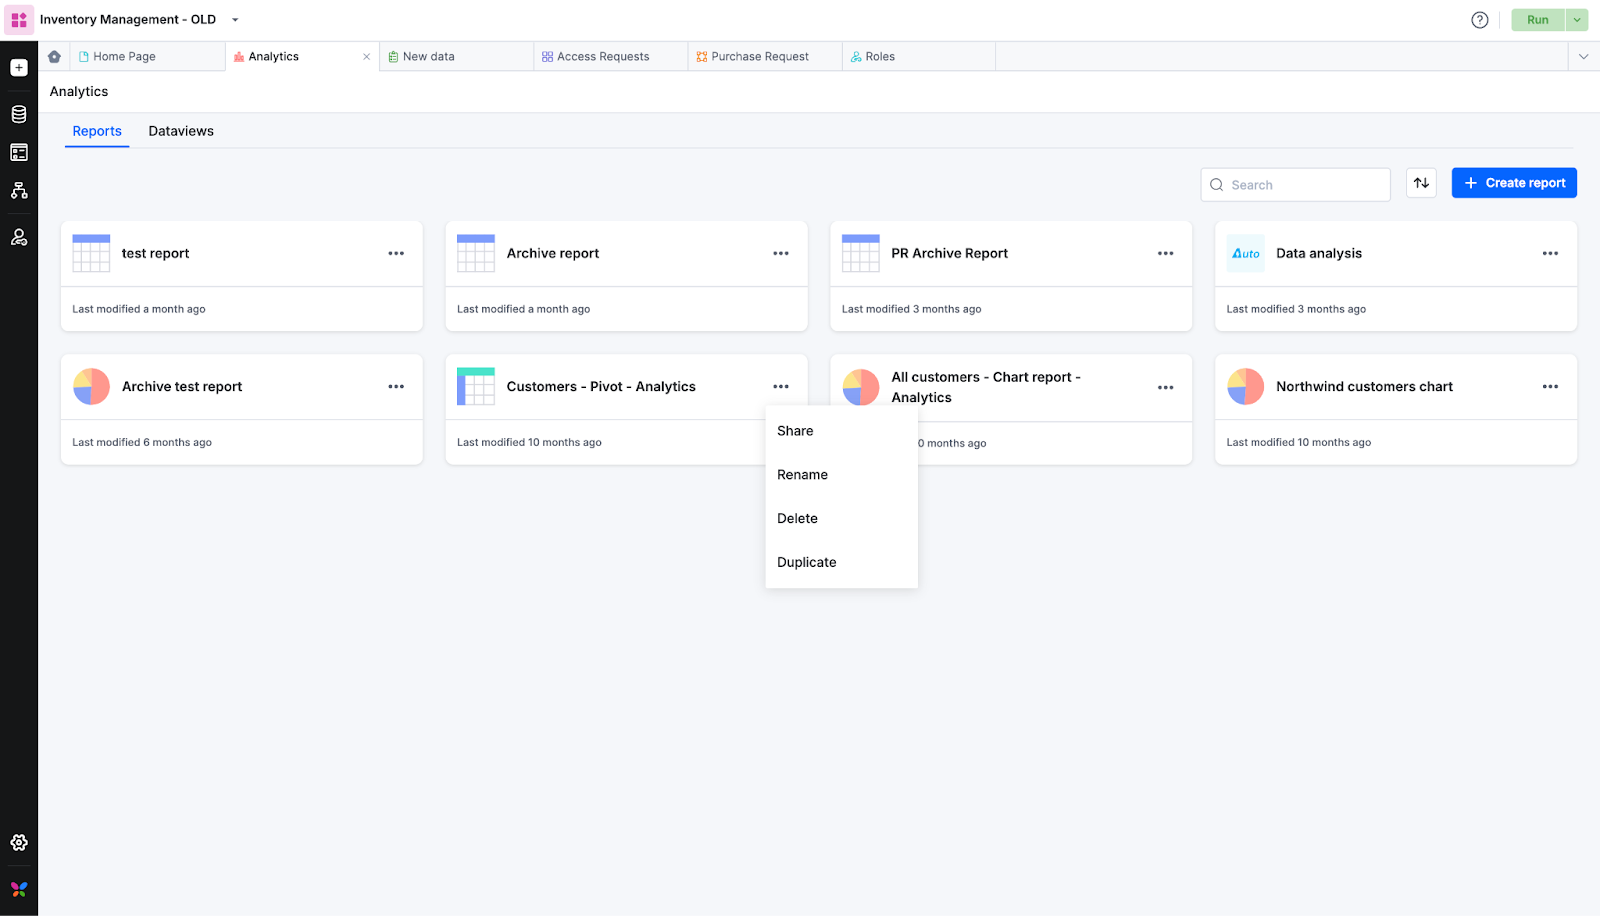
Once you have created the report, you have several ways to administer it. Under Reports, click the More options button (
Share - Share the report with the roles created in apps.
Export - The export option is applicable only for tabular reports. This option allows you to export all the data in a tabular report as a CSV or JSON file. Once you export a report, you will receive an email with a link to download it.
Note: You must enable the export header while configuring a tabular report on a page to use the export option.
Additional actions
Click the More options button (
Click Edit > Configure report page > Select the fields of the data source using the settings such as dimension, measure and legend > Click Save.
Rename a report > provide the new name > click Rename.
Click Delete to delete the report.
Select the Duplicate option > provide the required name for the copy of your report > Click Duplicate. A copy of the selected report, including the share permissions and the customizations, will be created in the Reports page.
Using analytics reports in the page builder
To utilize analytics within the page builder, follow these steps:
Drag and drop the report component - Tabular, Chart, Pivot that you wish to visualize onto your page.
In the settings, choose the flow type as Analytics.
Select the desired report that you want to appear in the page builder.
If any filter parameters were added, they will appear under Filter parameters.
Enable the Show header to access header for your reports.
Once the header is enabled, you can see options for data update, sorting, filtering, showing/hiding fields, and exporting.
- For charts, you can see data update icon and sorting on a page builder.
- For pivot reports, only the data update icon will be available.
The details of the report components such as Component ID, Report ID, and Data source ID can be viewed under Component details.
- The component ID is essential to get details about a particular report component using SDK commands.
- Report ID and Data source ID are used for reference.
Note: You can also configure custom drilldown using on click events for your chart and pivot report component inside the page builder.