Process dashboards
The process dashboard provides actionable metrics to monitor how efficiently each process runs. It’s ideal for both process admins and users as it highlights stuck or delayed items, average handling times, and patterns that affect throughput.
Admin dashboard
Process admins, Data admins, and Report admins can identify workflow gaps and overall efficiency using the following default widgets:
AI insights: AI analyzes your workflow data to uncover patterns and trends that aren’t easily visible in standard reports. These insights highlight opportunities for improvement, helping you make informed decisions and address bottlenecks.
Average time in each step
Overdue in last 30 days:
Tracks how often items exceed their due dates.
Shows the number of overdue items compared to all items with defined due dates.
Sent back items
Rejected items
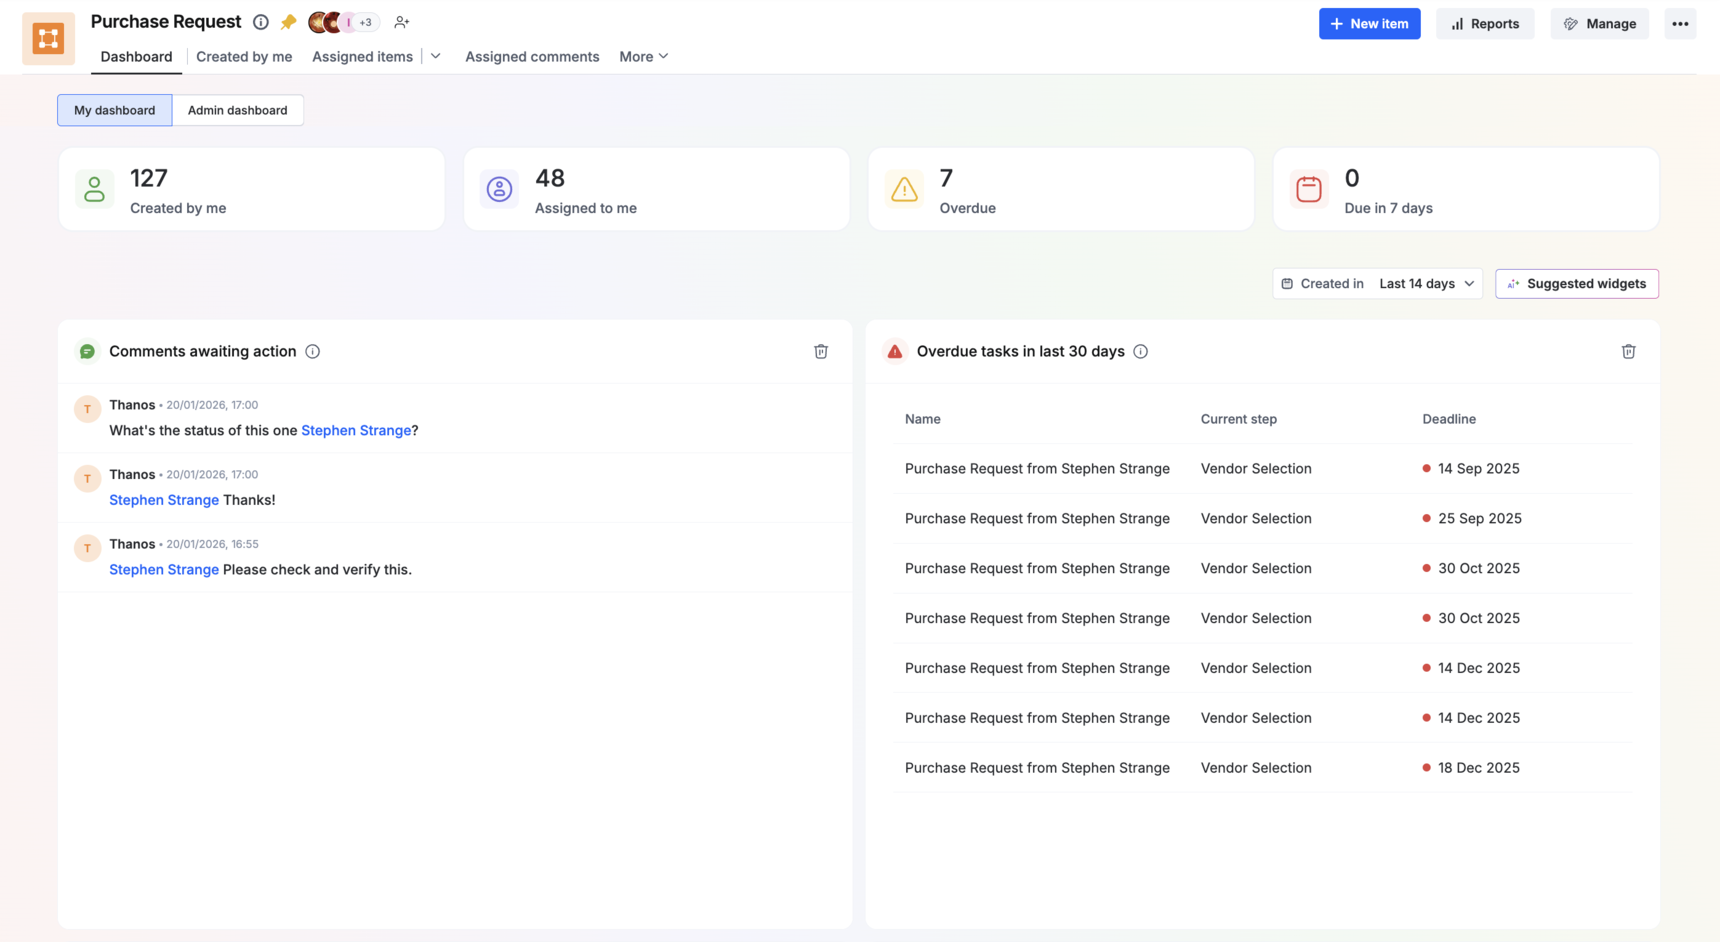
My dashboard
As a process user (all process roles), you can track your personal progress and pending tasks with the widgets below.
Comments awaiting my action: Displays mentioned comments that require your response (reply or reaction).
Overdue tasks
Escalated tasks
Due within 48 hours
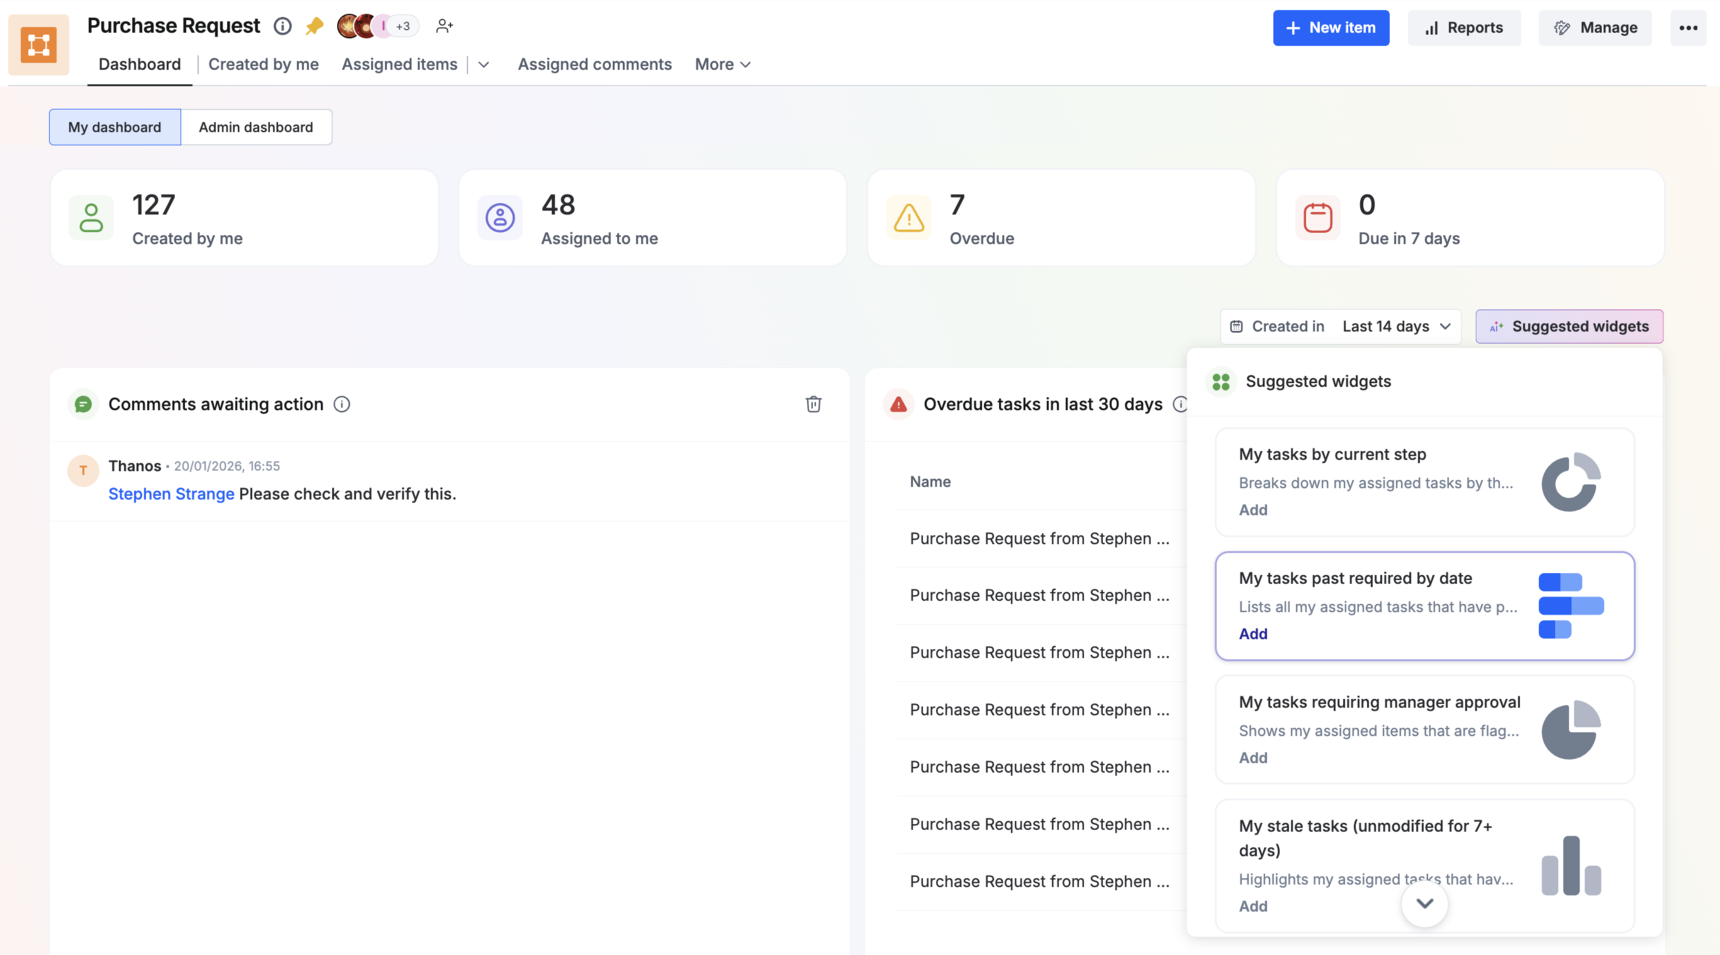
AI-suggested widgets
In addition to the default widgets, the dashboard offers AI-suggested widget recommendations to everyone except developers and members. These widgets present relevant insights as your workflow evolves, helping you make more informed and timely decisions.
You can add or remove any of these widgets on your dashboard to build a personalized view that suits your daily workflow.
The list of suggested widgets refreshes dynamically based on the progress and activity, providing updated insights over time.
Note:
Existing suggested widgets already added to your dashboard will remain intact when the list updates.